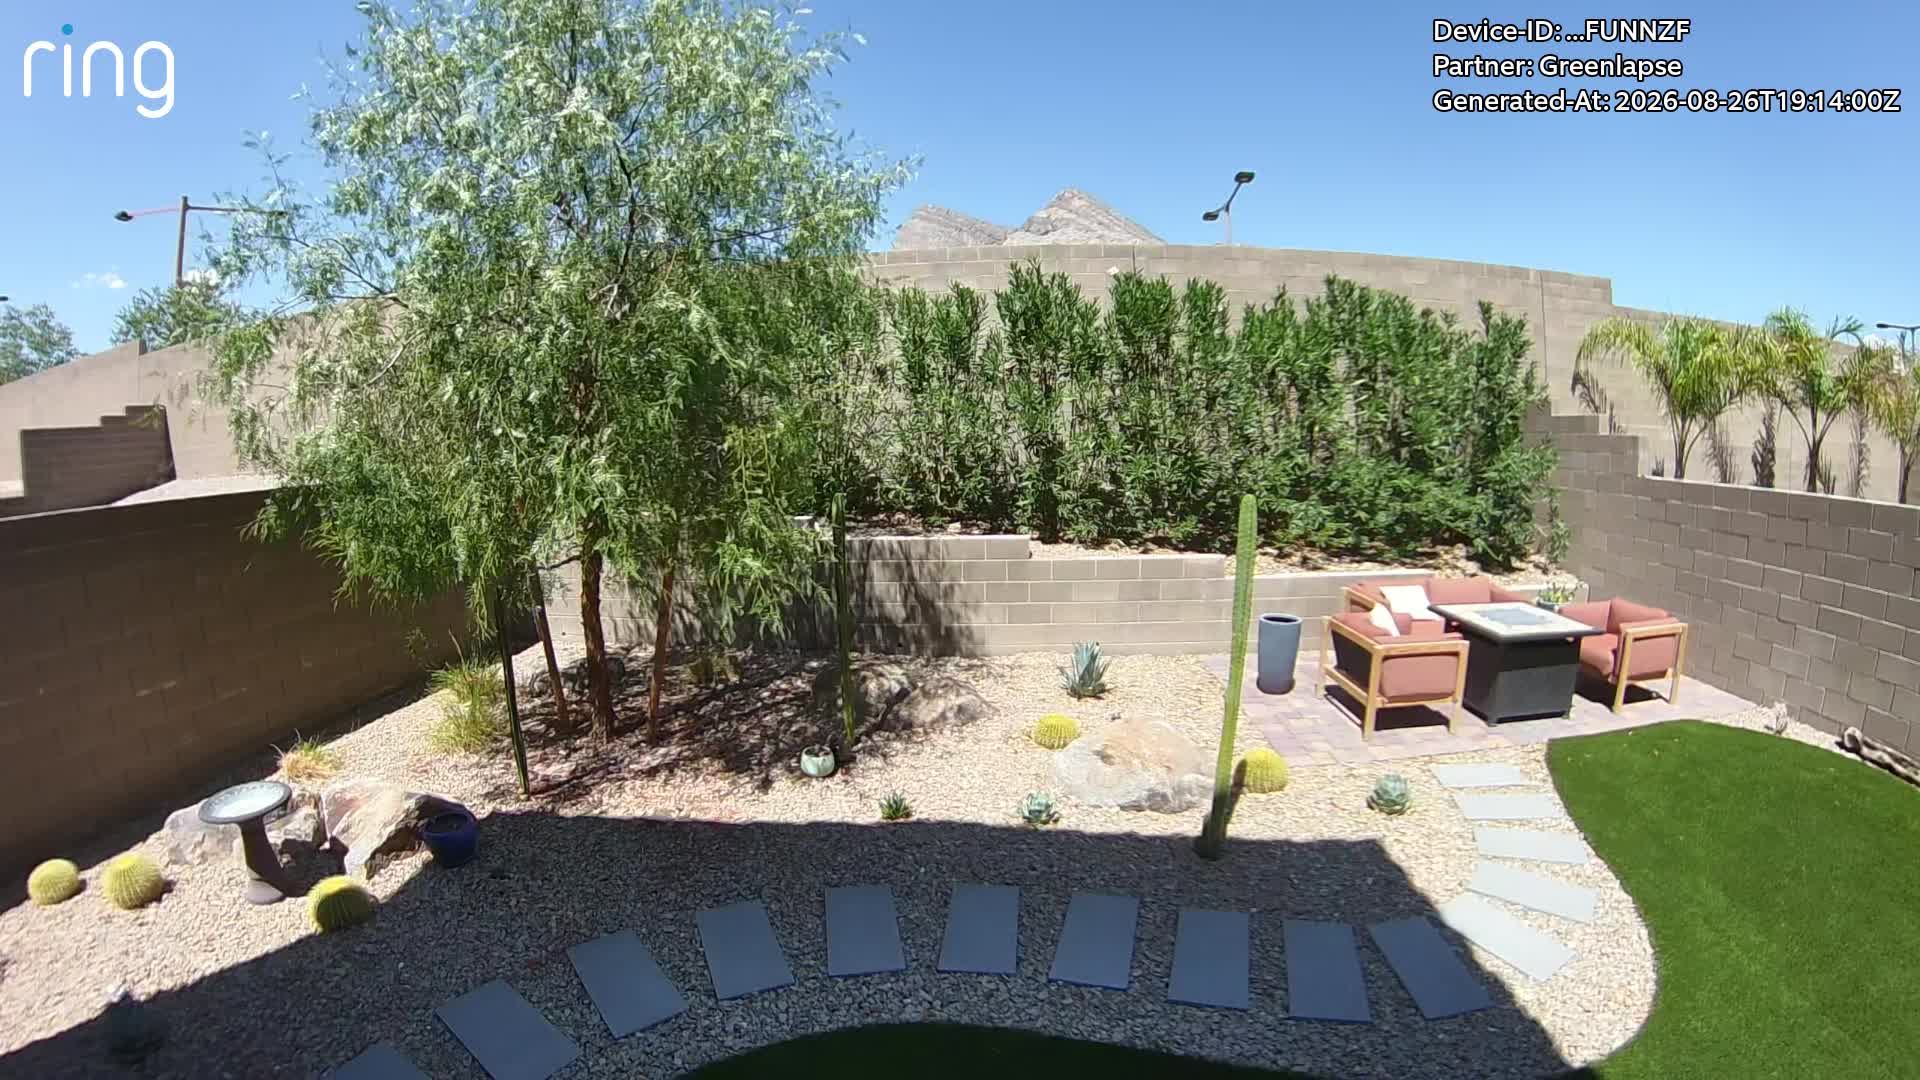
"Right plant, right place" is common gardening advice, and getting the light right is the hardest part of following it. Putting a full-sun plant in a spot that turns out to be part-shade (or vice versa) is one of the most common reasons plants don't thrive.
Why yard sunlight is hard to guess
The sun moves. It's nearly impossible to hold an accurate map in your head of where sunlight falls hour-by-hour throughout the day. A spot that's totally shaded in the morning may bake in the afternoon.
Seasons change the geometry. The sun sits much lower in the sky in December than in June. A tree that casts a short in early summer might block a whole flower bed in September.
Your yard is evolving. Trees grow. Fences get built. That mature maple next door didn't exist ten years ago, but now it's the biggest source of shade in the corner of your yard.
Creating a sunlight heatmap
Greenlapses helps you better understand sunlight patterns in your yard by generating seasonal heatmaps. Once a season, Greenlapse will take photos of your zone at 30-minute intervals throughout the day to build a set of images for analysis. Once we have enough clean captures to work with, our algorithm identifies which parts of the zone were in direct sun and which were in shade during each frame. Stacking that together produces a heatmap of your zone.
The color coding is simple, and it lines up with the labels you'll see on plant tags at any nursery:
- Blue: full shade, 0 to 2 hours of direct sun per day
- Green, yellow, orange: in between, roughly 2 to 6 hours
- Red: full sun, 6+ hours
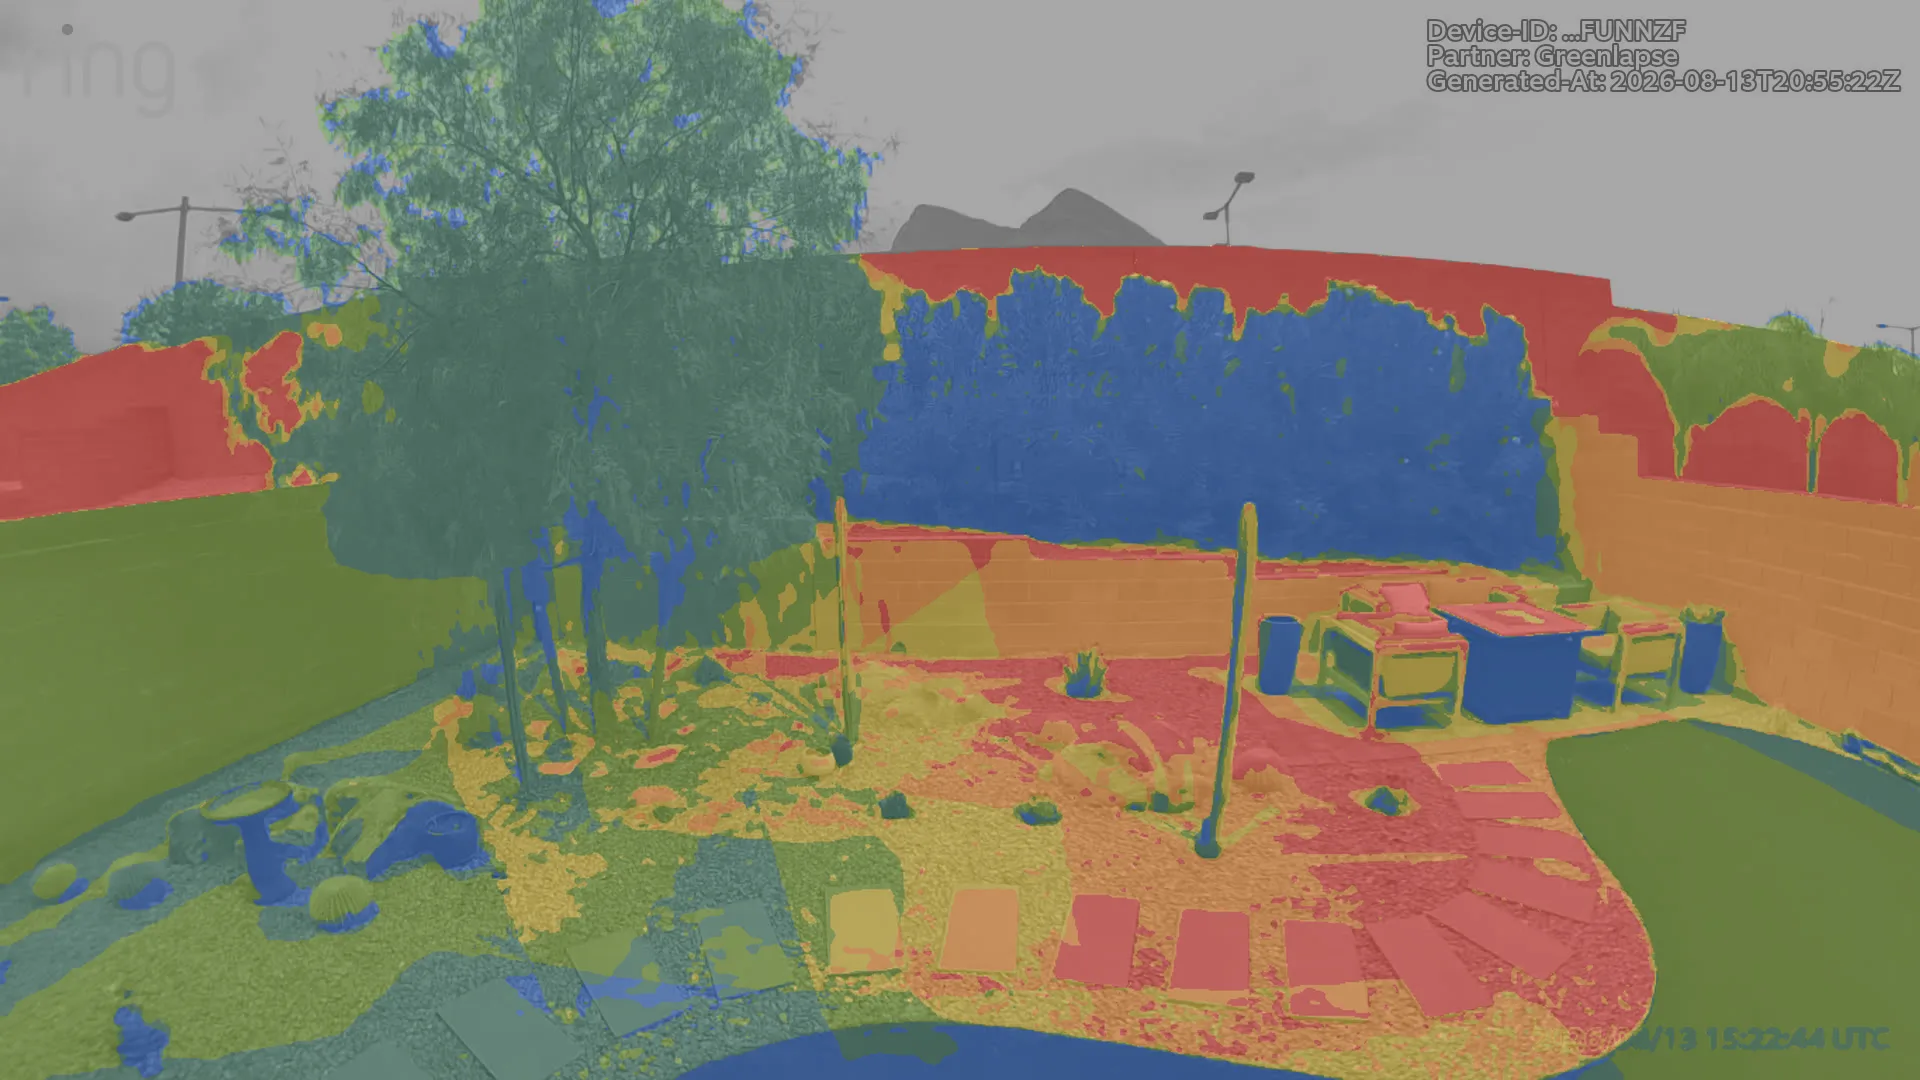
This isn't a perfect science yet. We're actively refining the methodology, and there are edge cases (very thin foliage, very brief sun windows, reflective surfaces) where the estimate isn't quite right. But for most yards, it gives you a solid, actionable picture of your light.
How this compares to other approaches
Sun-position calculators (Sun Surveyor, SunCalc, and similar): math from latitude, date, and time. Doesn't know about your trees, your fence, or small buildings.
LIDAR or 3D scanning apps: great for hard surfaces like buildings. Foliage defeats them, and foliage is usually where the shade comes from.
Manual photo tracking: works if you're home all day. And even then, there's no way to stitch scattered phone photos into a coherent coverage map.
Light meters: instant reading at one spot. No coverage map, no seasonal continuity.
Daily photos plus computer vision handle the messy parts (trees, changing light, seasonality) natively, because they measure what actually happens instead of calculating what should.
Think about how your yard will change
The trickiest planting decisions are about the future, not the present. Something you plant today might be surrounded by very different light in ten years, as saplings mature, canopies fill in above, and new construction reshapes the shade line.
When you're placing a plant that will live 20 or 30 years, take an educated guess about what the light will look like in five. A shrub or slow-growing perennial deserves that thought.
Matching plants to your zones
The heatmap colors line up with the categories nurseries use on plant tags:
- Full shade (blue): under 3 hours. Most hostas, hellebores, astilbe, many ferns.
- Part sun / part shade (green, yellow, orange): 3 to 6 hours. Hydrangeas, bee balm, ferns, coral bells.
- Full sun (red): 6+ hours of direct sun. Tomatoes, roses, lavender, coneflowers, most vegetables.
Pick a plant. Check its tag for the light requirement. Find a spot on your heatmap that matches. Two extra layers worth checking:
Time of day. Morning sun is gentler than afternoon sun. Hydrangeas love morning sun and fry in hot late-day sun. Tomatoes want the opposite. It matters not just how much sun a spot gets, but when.
Seasonality. A plant that wants 4 to 6 hours of sun in the growing season needs to still be getting real sun in April and September when it's actively growing.
Build the habit
- Check the heatmap before you plant anything new. Even things you're "sure" belong somewhere. Catches assumptions.
- Check back seasonally. Especially in spring and fall as leaves come and go. The heatmap will show shifts before your plants start reacting.
Every yard's sun is unique. A measured heatmap of what's actually happening is the closest thing to a cheat code for planting well.